If you want to use metrics to track your Free and Open Source Software (FOSS) community, you face a question: which metrics should I track?
To answer this question, you must know what information you need. For example, you might want to know about the sustainability of a project community. How quickly a community responds to issues. How a community attracts, maintains, or loses contributors. Once you know what kind of information you need, you can figure out which community activities can provide what you want to know. Fortunately, Free and Open Source Software (FOSS) follows an open development model, leaving a lot of public data in its software development repositories that we can analyze and collect useful data from.
In this article, I’ll introduce some metrics that provide a multi-faceted analysis of your project community.
1. Community Activity
The overall activity of a community and how it evolves over time is a very useful metric for measuring the health of any community. Community activity is the first impression of a community’s workload and can also be used to track different types of activities. For example, the number of commits gives the first impression of being linked to development workload. Through tickets opened, we can roughly know how many bugs have been submitted or how many new features have been proposed. The number of emails in mailing lists or forum posts can help us understand how many public discussions have taken place.
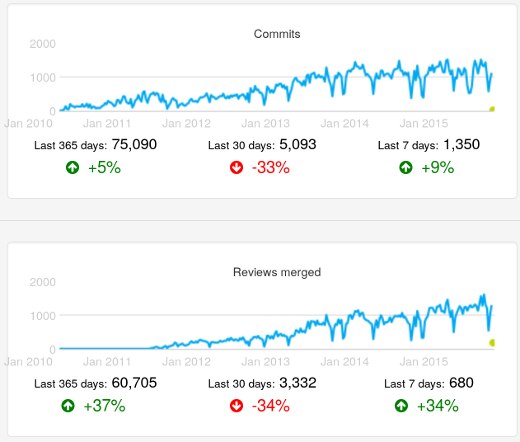
OpenStack Activity Dashboard showing trends in code commit times and code review merge times over time (weekly data)
2. Community Size
Community size refers to the number of people participating in the community, but there are significant differences based on different forms of participation. The good news is that you’re usually only interested in active contributors. Active contributors leave clues in the project’s repository. This means you can count the number of active code contributors by looking at the author field in the code stored in the git repository, or count active participants by looking at the number of people actively involved in issue resolution.
Activity (some people doing something) can extend to many aspects. A common way to track activity is to see how many people have done significant tasks. For example, contributors to a project’s code are usually a small part of the project community. Understanding this small group gives you a basic understanding of the core working group (e.g., the people leading the community).
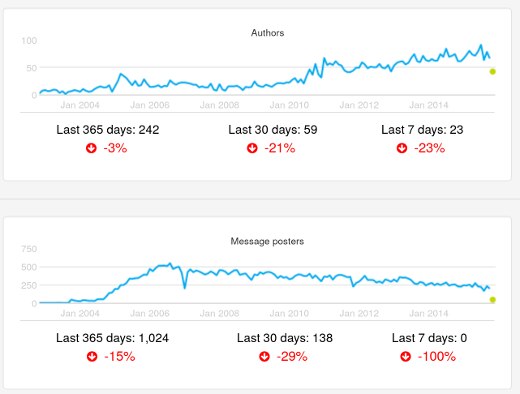
Xen Project Development Dashboard showing trends in the number of authors and committers on the project’s mailing list over time (monthly data)
3. Community Performance
So far, the focus has been on counting the number of activities and contributors. You can also analyze how processes and users perform. For example, you can measure how long it takes for a process to complete. The time to resolve or close issues can indicate how a project that needs timely response handles new information, such as fixing a reported bug or implementing a new requirement. The time spent on code review, from code change submission to approval, can show how long it takes to update a proposed change to meet community expectations.
Other metrics are mainly related to how well the project handles pending work, such as the ratio of new and closed issues, or the queue of code reviews that are still not completed. These parameters can tell us information like whether the resources invested in solving these problems are sufficient.
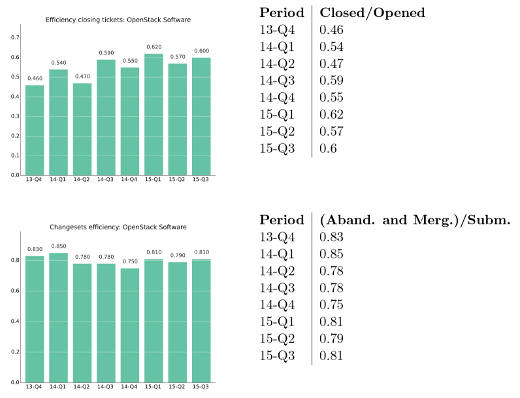
From the 2015 Q3 OpenStack Development Report, showing the ratio of closed to open issues per quarter, and the ratio of accepted and rejected change proposals to the latest change proposals
4. Community Demographics
Communities are constantly changing as contributors join or leave. As people join and leave the community, community members have different tenures (calculated from when they joined). The community age statistics chart visually shows these changes over time. The chart consists of a series of horizontal bars, with every two horizontal bars representing a generation that joined the community. For each generation, the Attracted horizontal bar shows how many people joined the community during the corresponding time. The Retained horizontal bar shows how many people are currently active in the community.
The relationship between the two horizontal bars representing a generation is the retention ratio: the portion of that generation still in the project. The complete set of Attracted horizontal bars shows how popular the project was in the past. The complete set of Retained horizontal bars shows the current age structure of the community.
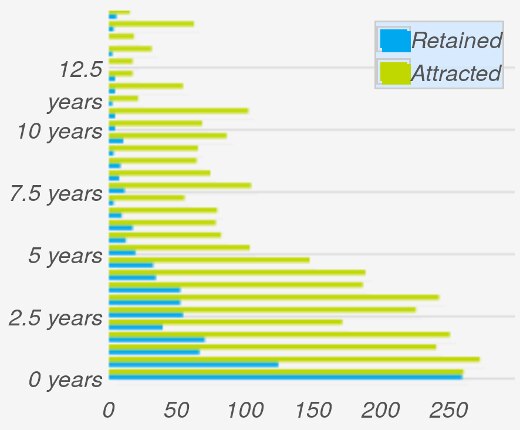
Eclipse Development Dashboard showing the community age table for the Eclipse community. Defined every six months
5. Community Diversity
Diversity is a key factor in maintaining a community’s resilience. Generally speaking, the more diverse a community (diversity in people or organizational participation), the greater its resilience. For example, if a company decides to leave a free open source community, the potential problems caused by its employees contributing 5% are much smaller than if they contributed 85%.
Pony Factor, coined by Daniel Gruno, refers to the phenomenon where the minimum number of developers contributes 50% of code commits. Based on the Pony Factor, Elephant Factor refers to the minimum number of companies whose employees contribute 50% of code commits. These two figures provide an indication of how many people or companies the community depends on.
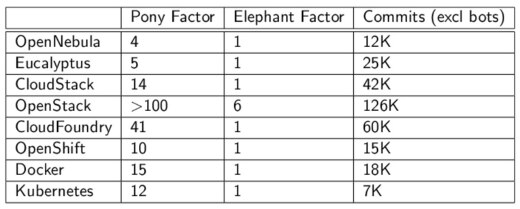
2015 Quantitative State of the Open Cloud showing the Pony and Elephant Factors for several free open source community projects in the cloud computing field.
There are many other metrics to measure a community. When deciding which metrics to collect, consider the community’s goals and which metrics can help you.
Reprinted with permission: Developer Relations »